Transforming Network Data into Interactive 3D Insights
A smartboard concept that makes global network performance easier to interpret, faster to act on, and more collaborative to use.
About Catchpoint
Catchpoint provides enterprise-grade digital experience monitoring solutions, helping IT teams optimize web performance, diagnose issues, and ensure seamless end-user experiences.
Design Challenge
Design a new smartboard to visualize real-time network performance in a way that is easy to understand and act on. The goal was to give IT teams a more intuitive way to monitor global activity, surface key metrics, and make faster decisions.
Users
- IT Administrators managing network performance
- Network Engineers diagnosing real-time connectivity issues
My Role
- Senior Product Designer
- UX Researcher
- Facilitator
Research & Discovery

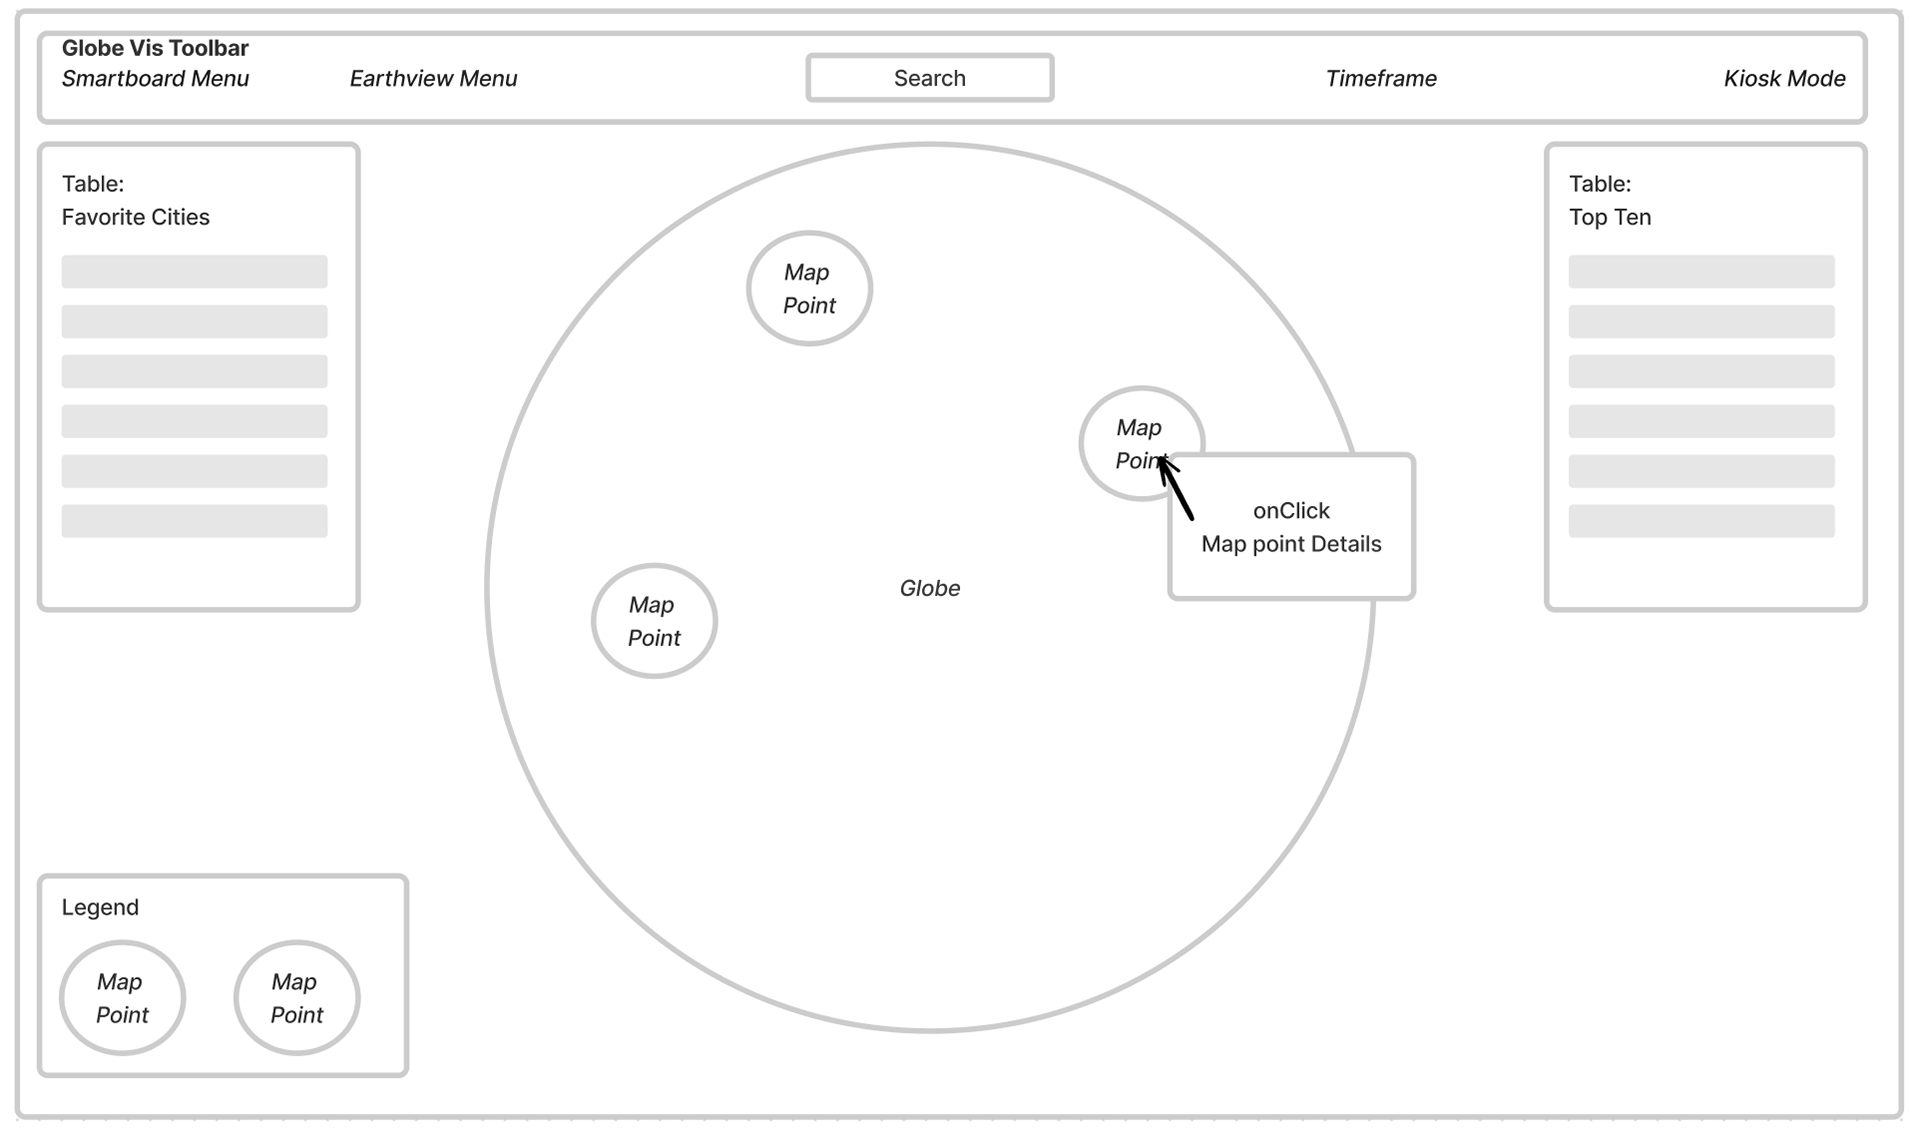
Ideation
Developed wireframes and low-fidelity prototypes to explore solutions. Presented concepts to stakeholders, iterating based on their feedback.
Deliverables
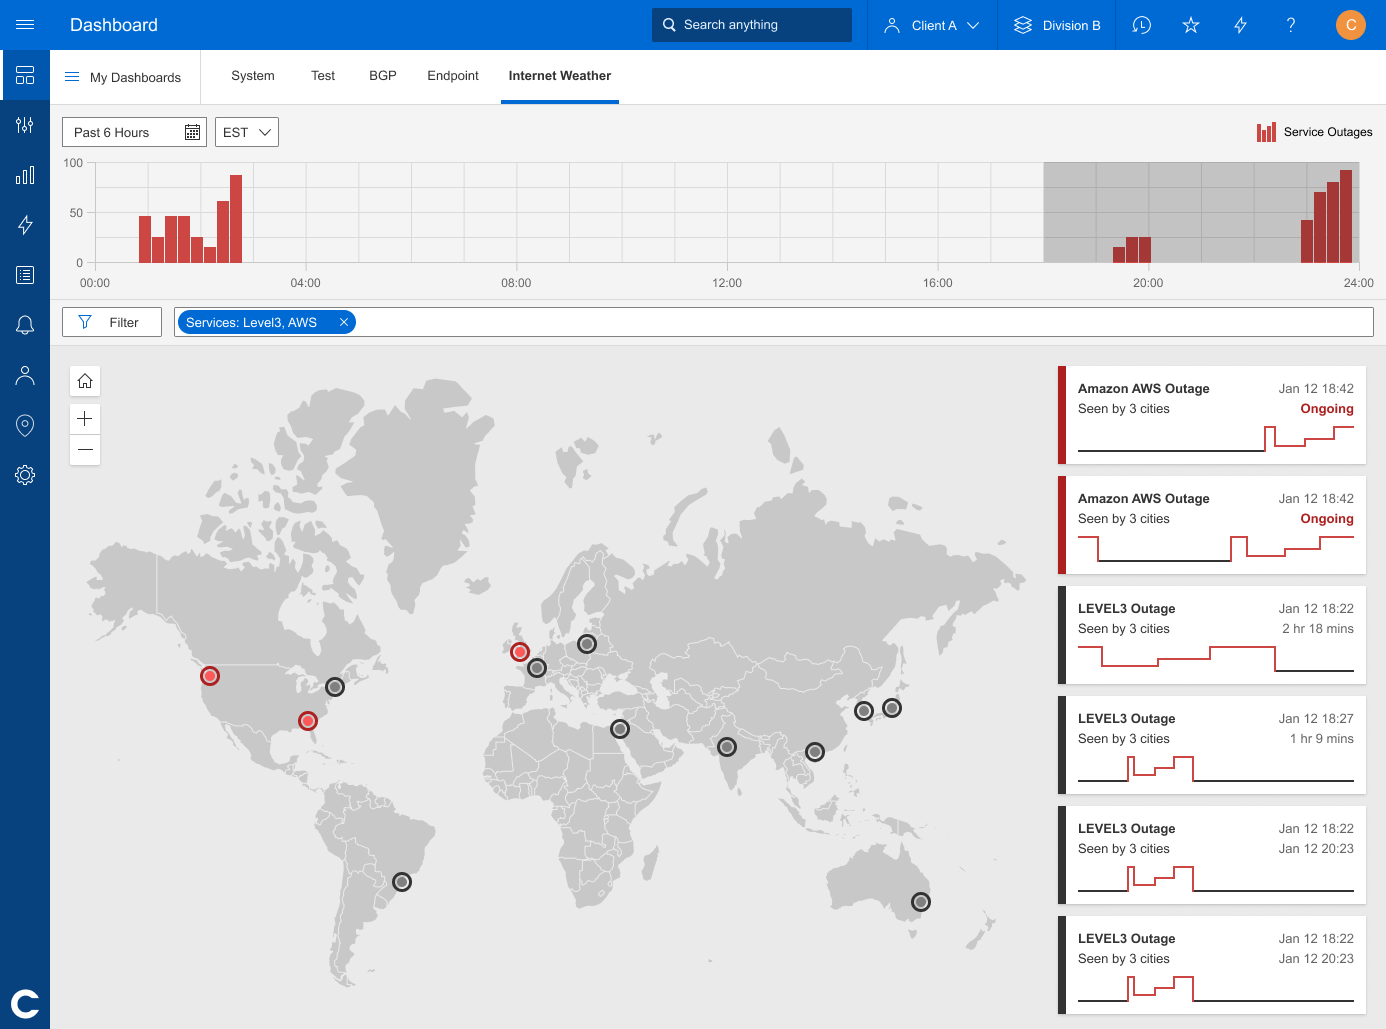
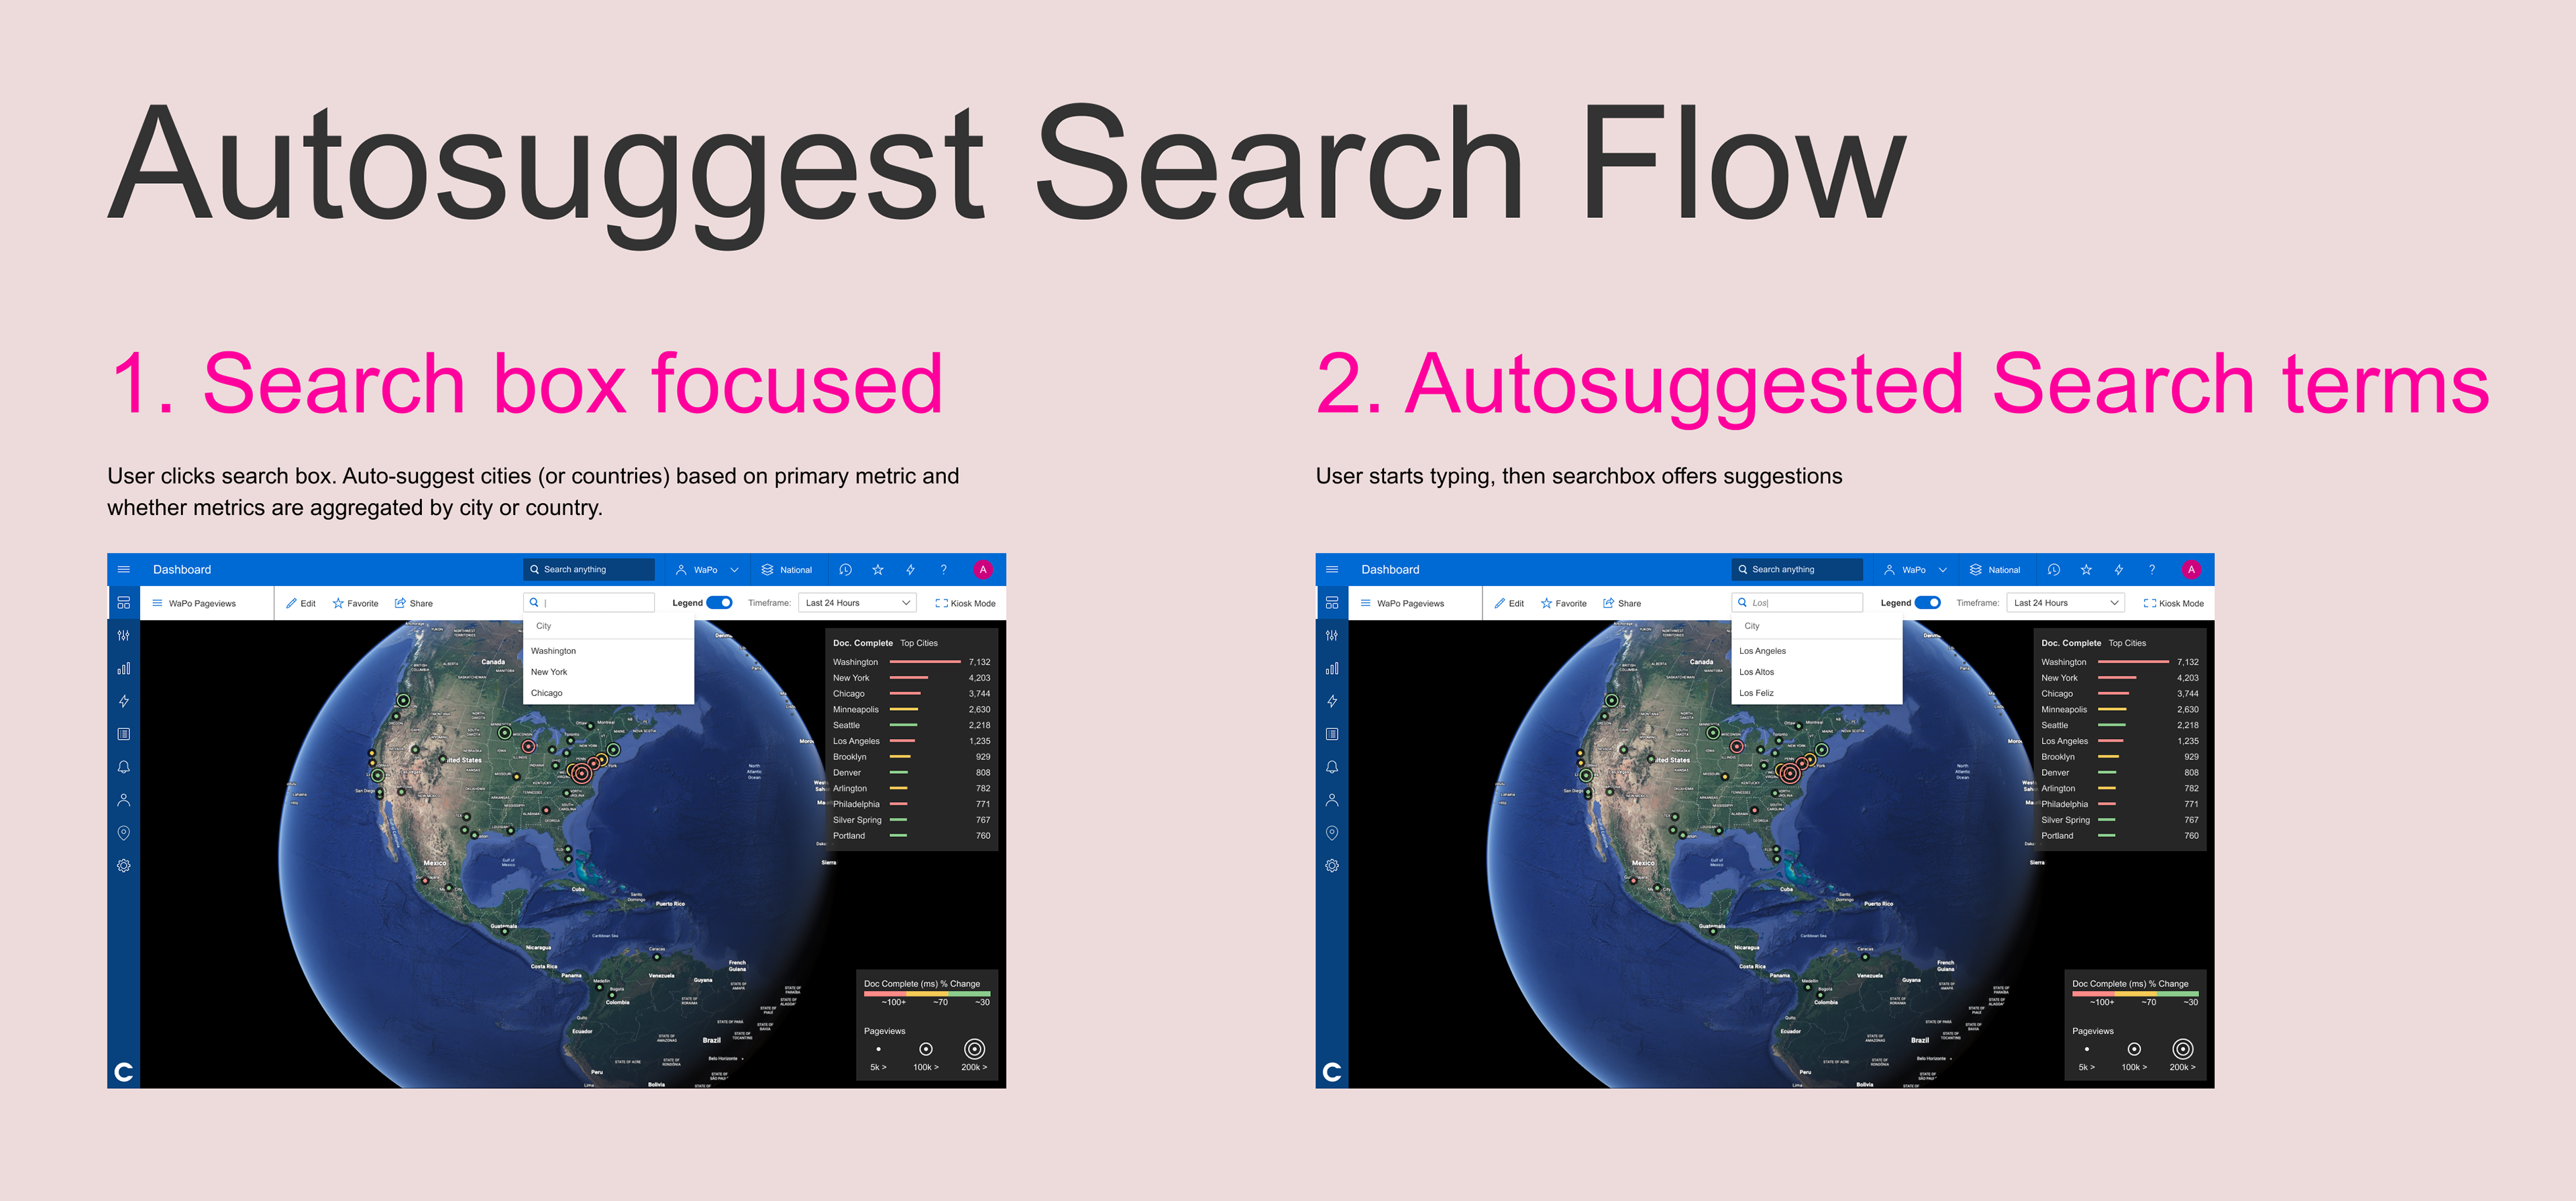
Prototypes: Developed high-fidelity prototypes in Figma with clear annotations for interaction patterns and functionality.
Testing & Refinement: Conducted usability testing with end-users to evaluate and refine the prototype. Incorporated feedback to optimize interactions, improve clarity, and enhance overall usability.
Developer Handoff
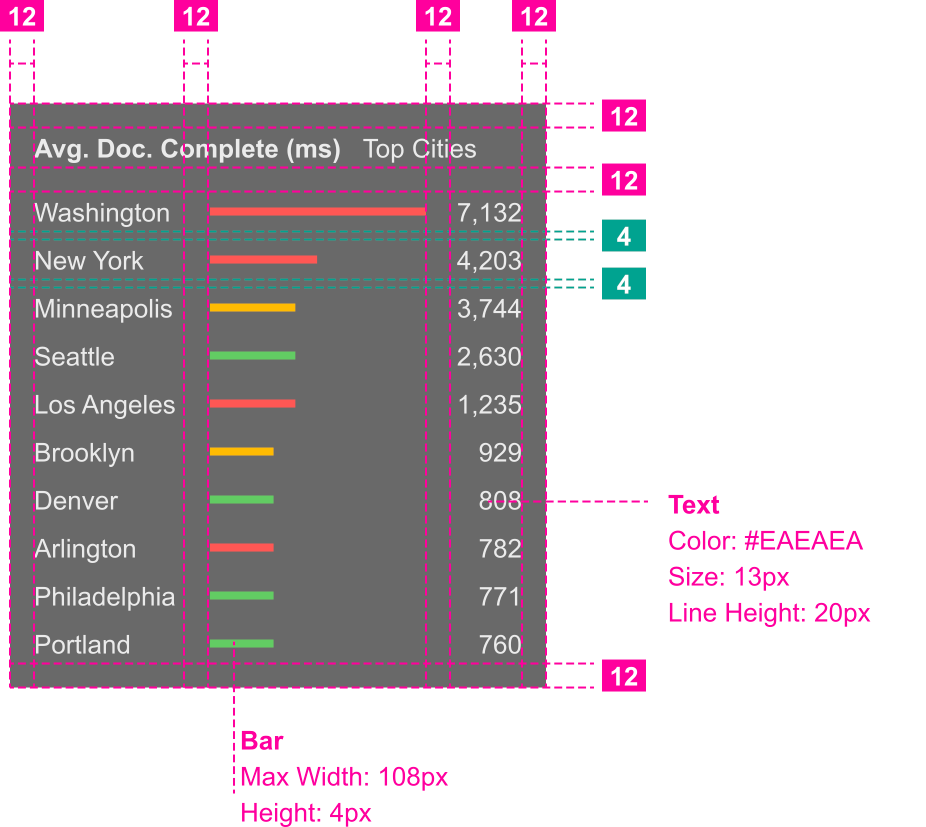
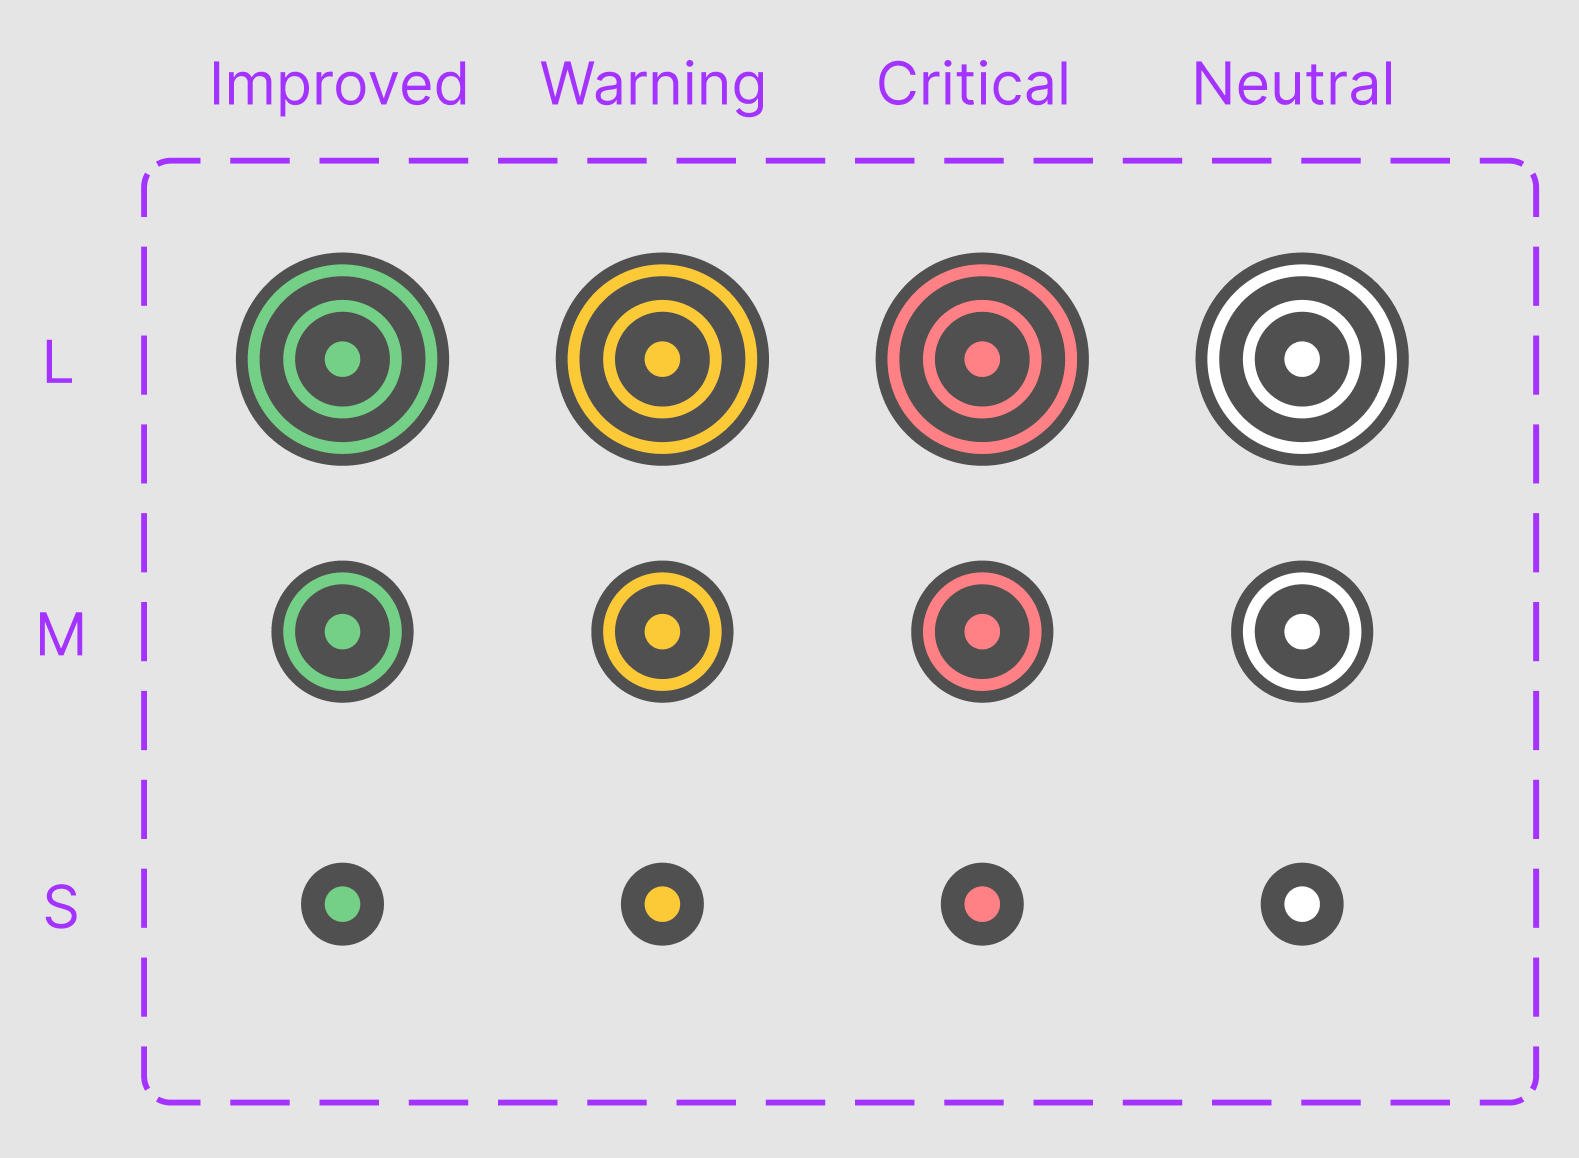
Ensured seamless collaboration with developers by providing detailed design specs and interaction documentation in Figma. Conducted regular check-ins during the development phase to address questions and ensure the final implementation aligned with the design vision. Created a design system with reusable components to streamline future iterations and updates.
Solution
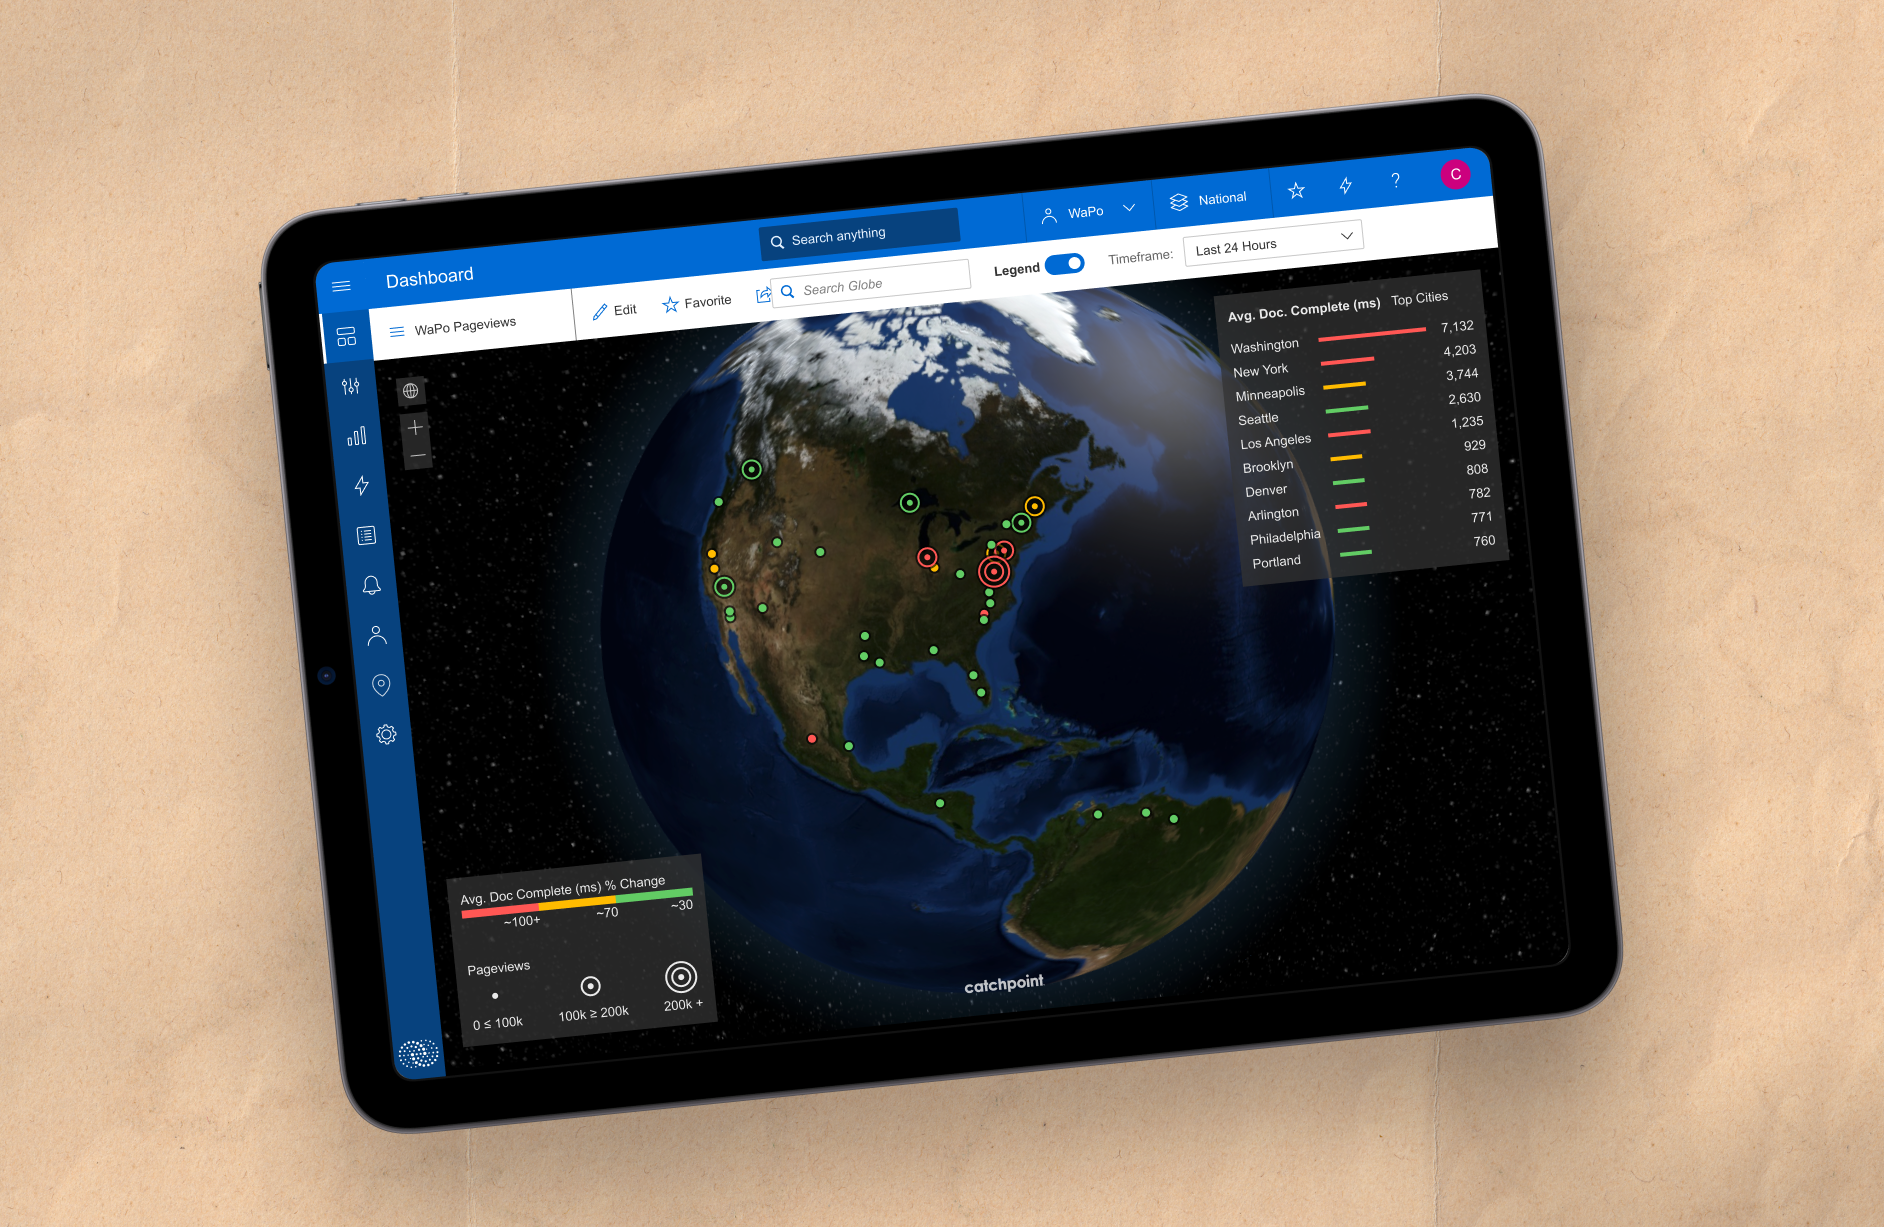
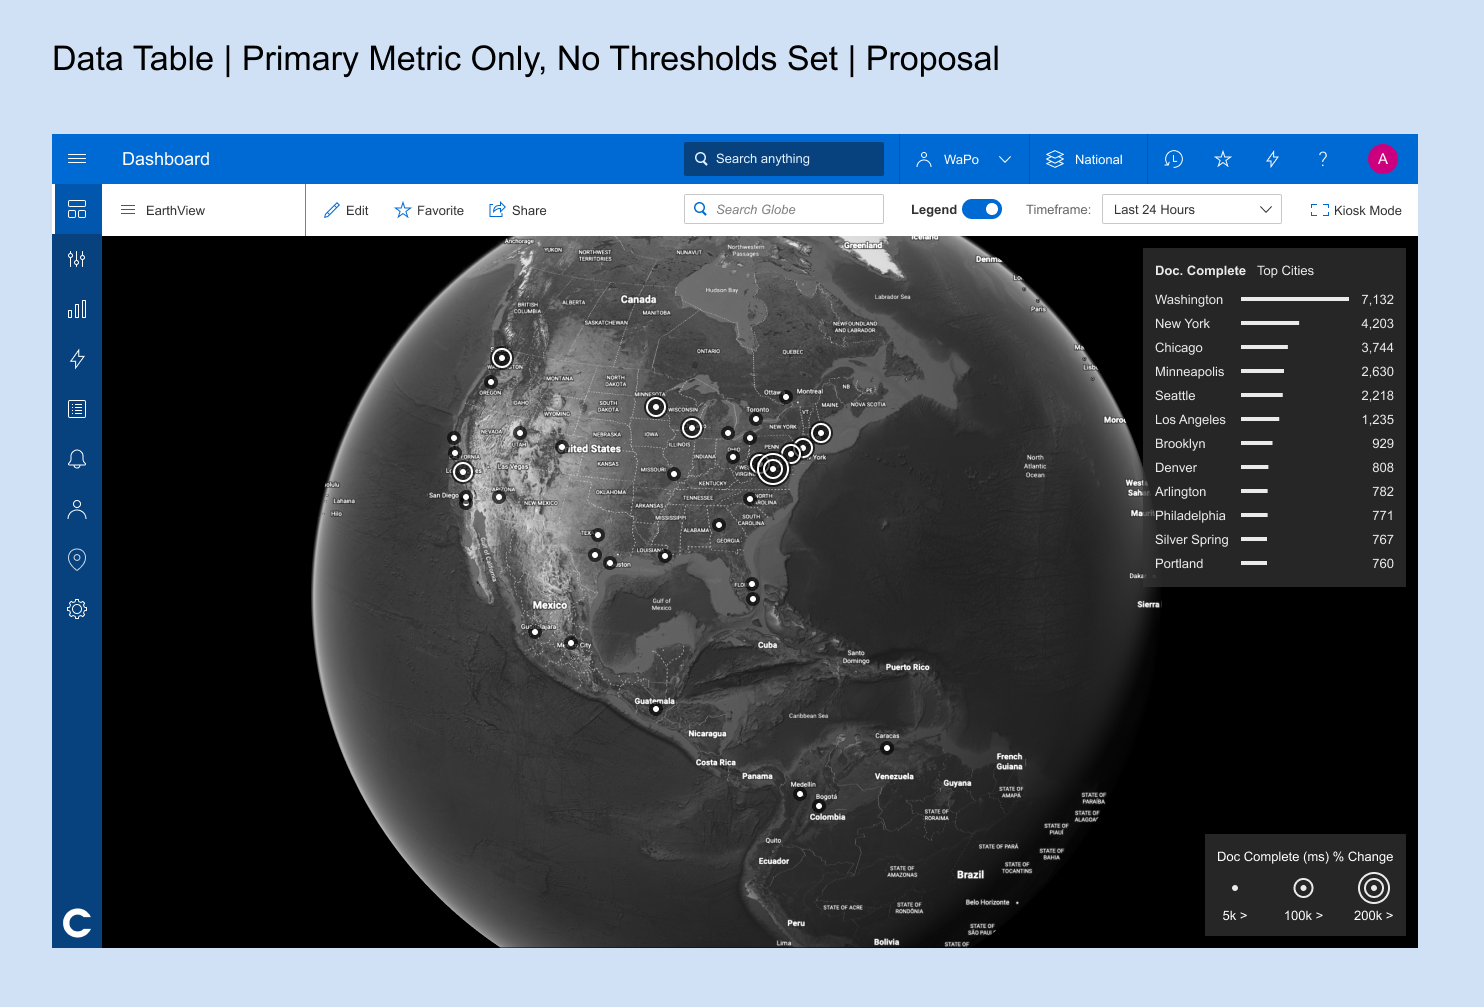
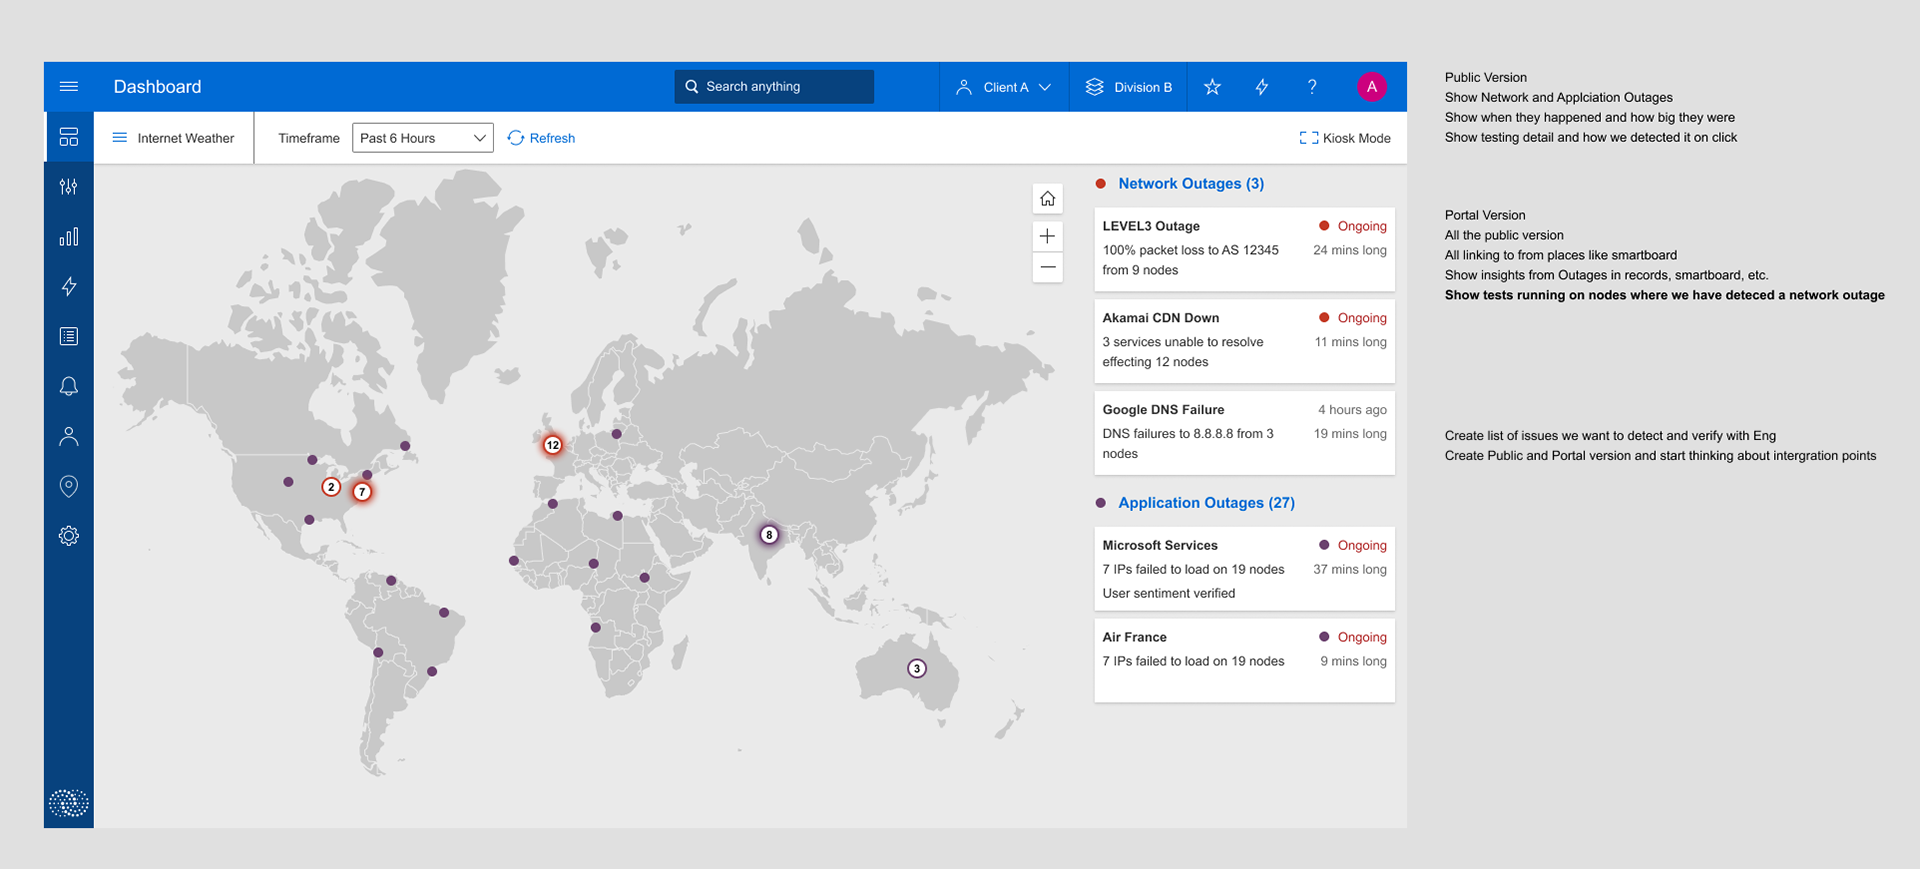
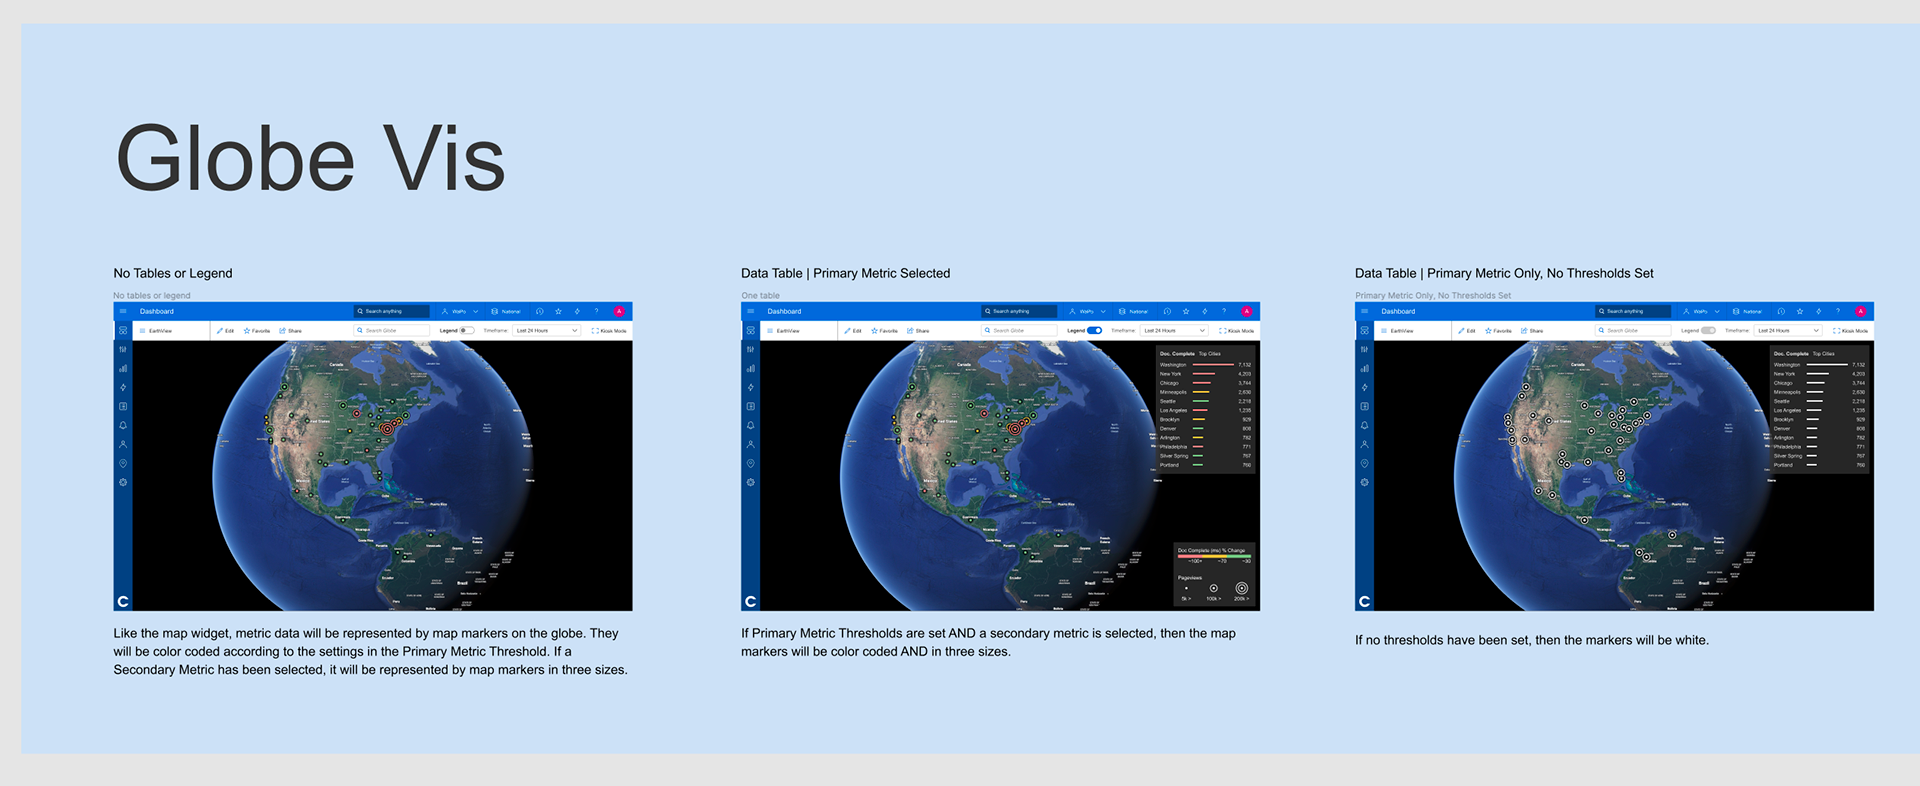
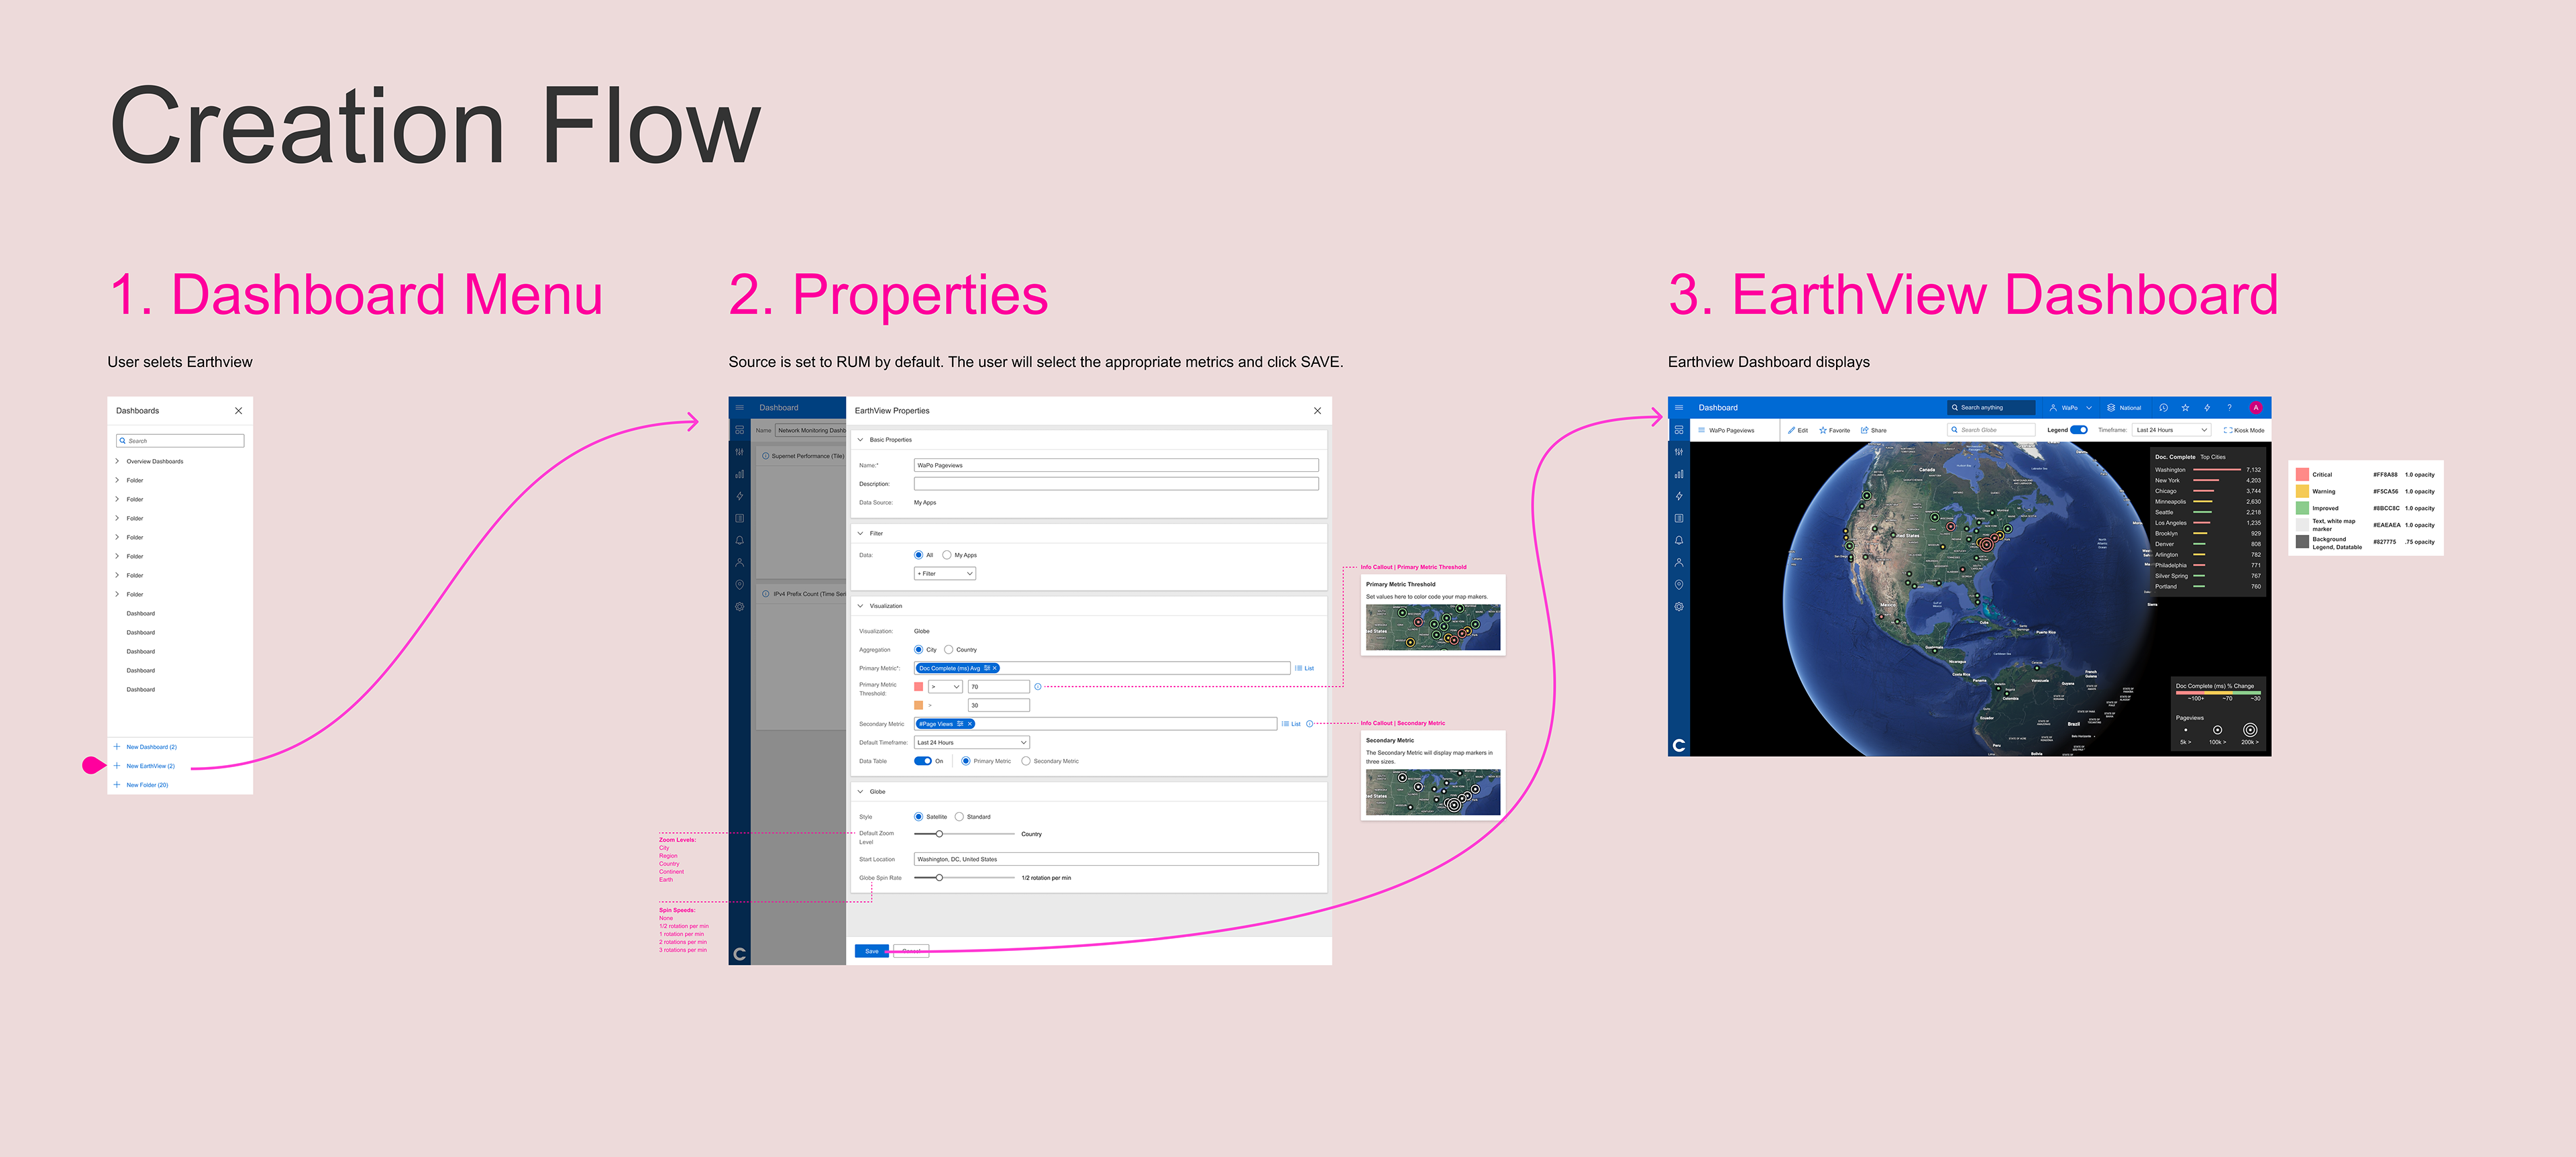
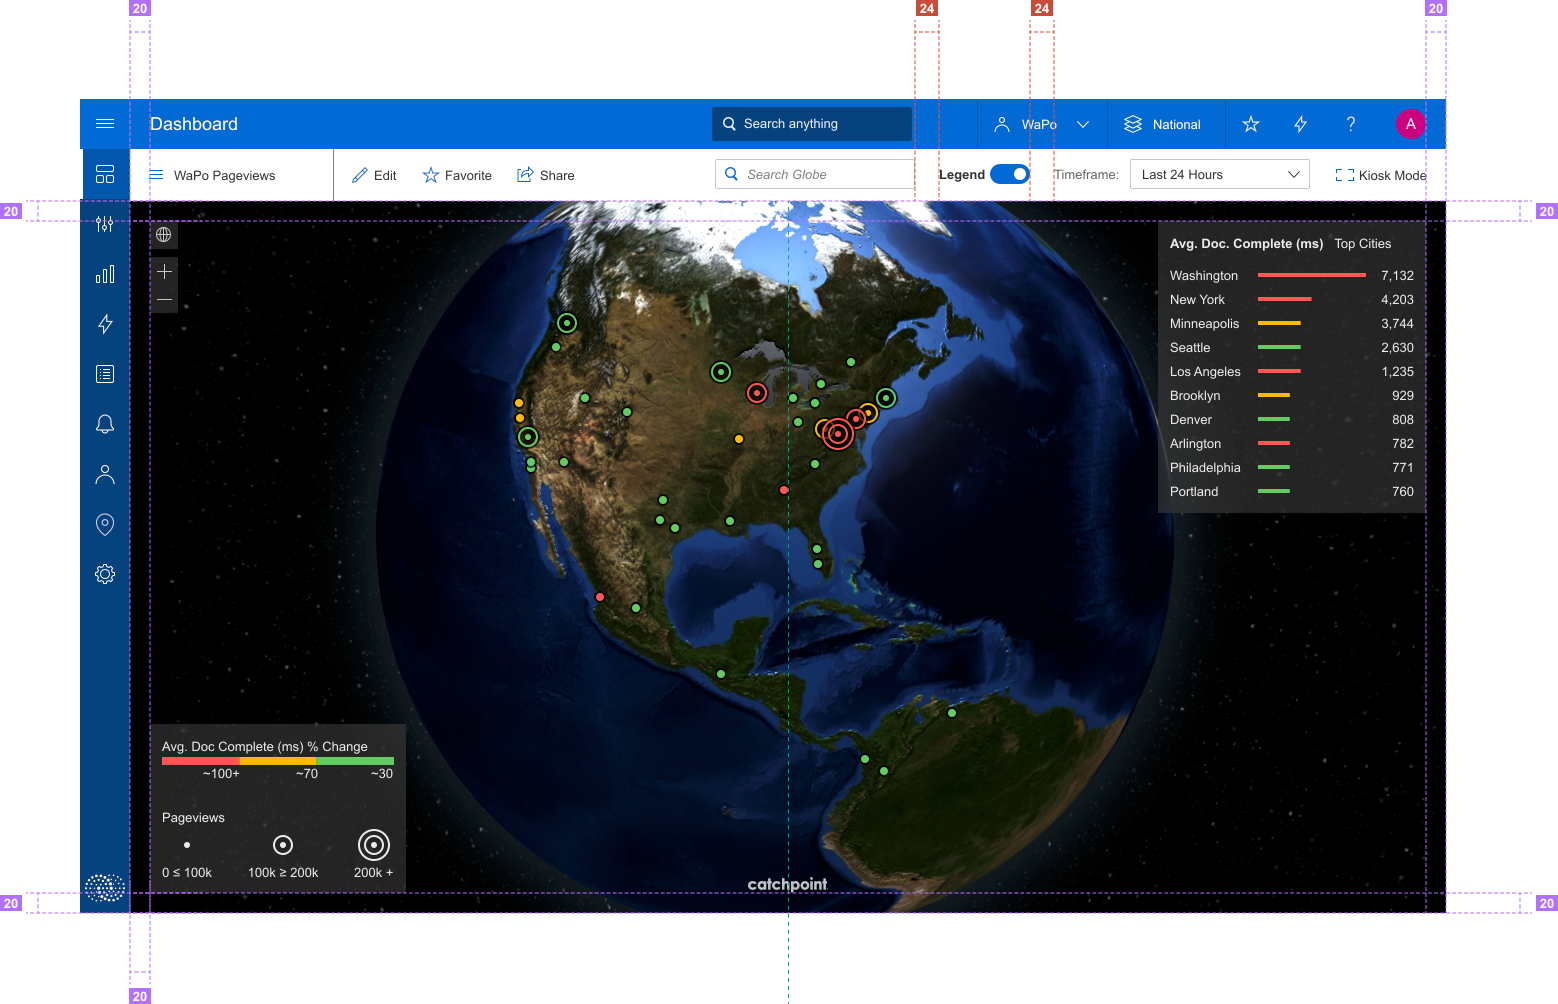
The Earthview Smartboard features a 3D globe that allows users to visualize global network performance in real time. Key features include interactive zoom and data clustering for faster insights, a simplified visual hierarchy to highlight critical metrics, and seamless integration with Catchpoint's broader ecosystem for a cohesive user experience.
Outcome
Reduction in time spent analyzing performance data by nearly 30%. As part of Catchpoint's Symphony UI Feature Suite, IT adoption increased 43 points to 86% in less than a year. Positive feedback from stakeholders for improving both usability and visual appeal.
Reflection
This project reinforced the importance of competitive analysis in designing standout solutions and the value of collaboration during developer handoff. By bridging design and engineering, we delivered a product that improved user workflows and enhanced Catchpoint's market presence.